System Tree
The system tree is the top left-hand window in the CrystalBridge® Monitoring Cockpit. It displays the list of all created systems and their servers in CrystalBridge® Monitoring. It is divided into two parts:
-
System landscape
-
Each node represents a system with its name or system ID based on the defined user display settings. Below this system node, a list of application servers and database servers assigned to this system is displayed.
-
You can categorize the systems into system groups, which have a similar function to folders. It is also possible to assign one system to multiple system groups. For more information, see the chapter Assigning a System to a System Group.
-
Alert
-
This column displays the number of alerts that have occurred.
-
Next to the System node, there are two numbers available. The first number defines how many open alerts exist for this system. The second number defines how many alerts have already been closed.
-
Next to the Server node, there is only one number available. This number defines how many open alerts exist for this specific server.
You can select or deselect each node for a system or server. If no data is collected or data does not exist in the selected time period for this system, the node is marked as a gray-colored node and behaves as inactive, meaning that you cannot select it.
If you select any system, you can find additional details about this system in the System info tab. Note that this is also possible also for inactive nodes.
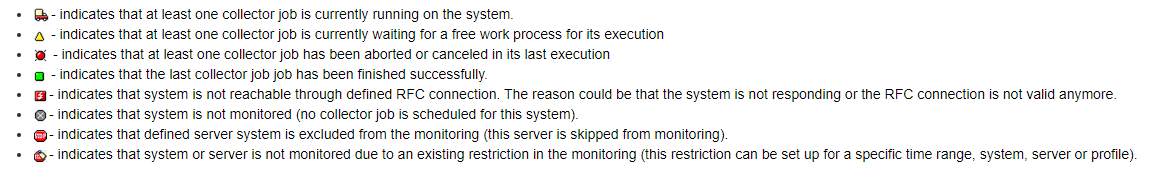
Each node in under System landscape contains a status icon. This icon informs you about the current monitoring status. The following status icons are possible:
Context Menu for Systems
Under System landscape, you can right-click a system node to maintain the system.
The following options are available:
-
Select all: Selects the current node and all its subnodes. If you have right-clicked the system group, all nodes defined in this group are selected.
-
Deselect all: Deselects the current node and all its subnodes. If you have right-clicked the system group, all nodes defined in this group are unselected.
-
Select all below for
-
currently open alerts: Selects only the nodes that reported any open alerts at the current time. This selection is only applied to the current node and all its subnodes.
-
occurred alerts in displayed time range: Selects all nodes that reported open or closed alerts in the displayed time period. This selection is only applied to the current node and all its subnodes.
-
-
Stop monitoring: This option is only visible when the system is currently being monitored. It provides two options:
-
Stop monitoring: Stops all collector jobs for the selected system.
-
Stop monitoring with memory: Stops all currently running collector jobs. The program remembers these stopped collector jobs for specific systems in the memory. When using this option, you can only restart these stopped collector jobs later.
-
-
Start monitoring: This option is only visible if the system is not yet being monitored. It provides three options:
-
Start monitoring (all profiles): Starts all collector jobs defined for the system, including custom-created Y* or Z* profiles.
-
Start monitoring (default profiles): Starts only collector jobs for default monitoring profiles, without any custom-created Y* or Z* profiles.
-
Start monitoring from memory: Starts only collector jobs that were stopped using the function Stop monitoring with memory beforehand. This option is only visible if a snapshot for stopped collector jobs is found in the memory for the selected system.
-
-
Delete system: Deletes the entire system definition. For more information about system deletion, see the chapter Deleting Systems from the Monitoring Scope.
Context Menu for Servers
Under System landscape, you can right-click a server node to maintain the server.
The following options are available:
-
Exclude from monitoring: Excludes the specific server from monitoring. This option is only displayed when the selected server is not excluded from the monitoring.
-
Include from monitoring: Restarts the monitoring for this excluded server. This option is only displayed when the selected server has been already excluded from monitoring.
-
Delete server: Deletes the server. This option is only displayed when the server is not reachable and is excluded from the monitoring. As a result, this option is only displayed in the context menu if these two conditions are met. The reason is that it is only possible to delete servers that can no longer be reached and that can therefore no longer be monitored, for example obsolete servers.